5 Our Networked Selves
Outline
Networks All the Way Down
When I was at university, I was struck by some of the parallels I would at times notice between courses in very different disciplines.
For example, in a modern philosophy course, I learned about David Hume’s bundle theory of the self. Hume’s observations and reasoning led him to reject the notion that we possessed an internal essence, or soul, at the core of our being which was responsible for our sense of a unitary self persisting through time. Rather, Hume writes,
…I may venture to affirm of the rest of mankind, that they are nothing but a bundle or collection of different perceptions, which succeed each other with an inconceivable rapidity, and are in a perpetual flux and movement. Our eyes cannot turn in their sockets without varying our perceptions. Our thought is still more variable than our sight; and all our other senses and faculties contribute to this change: nor is there any single power of the soul, which remains unalterably the same, perhaps for one moment. The mind is a kind of theatre, where several perceptions successively make their appearance; pass, repass, glide away, and mingle in an infinite variety of postures and situations. There is properly no simplicity in it at one time, nor identity in different, whatever natural propension we may have to imagine that simplicity and identity. The comparison of the theatre must not mislead us. They are the successive perceptions only, that constitute the mind; nor have we the most distant notion of the place where these scenes are represented, or of the materials of which it is composed.
– A Treatise of Human Nature, Book I, Part 4, Section 6, ‘Of Personal Identity’
Later, in a Buddhism course, I was introduced to the concept of anatta, meaning no-self. According to this fundamental Buddhist doctrine, nothing, including ourselves, has an unchanging, permanent core (a self), which constitutes an object. Rather all objects, including ourselves, are heaps, aggregates, collections, or groupings. This implies that objects are constituted by relationships between aggregates, which are themselves constituted by relations between aggregates. Recall from Chapter 1 that what differentiated diamonds from graphite were the relations between their carbon atoms. If we zoom into the atomic structure of carbon, and the subatomic structures within carbon, we find that they too are devoid of an internal, unchanging essence. No matter how far in or out we zoom, we find aggregates and networks of relations. Indeed, in Buddhism, anatta is considered one of three marks of existence: characteristics of all of life.
At the same time, I was taking a neuroscience course which introduced the homunculus problem. This is the problem of how to understand our brain’s mental and behavioral abilities without positing a “little man” (homunculus) that serves as a control center within the brain. Or, to put the homunculus fallacy another way, if the reason that the brain can do function X is because a region of the brain does function X, nothing has been explained. Rather, the problem has been moved to another, smaller location, and the question becomes: how is that brain region responsible for function X? The answer can’t, in turn, refer to some smaller portion of area X. This would create an infinite regress. To explain a phenomenon in neuroscientific terms is to show how that phenomenon is either produced or subserved by a series of processes operating over a network of physiological components. There isn’t an internal core, a homunculus, which produces and therefore can serve to explain mental and behavioral abilities.
I found it fascinating that a similar message was being articulated within western philosophy, eastern religion, and contemporary neuroscience! Could these parallels be considered converging evidence for the proposition that there is nothing essential about selves?[1]
I’m certainly not the only one to notice these parallels. For a vivid articulation and further elaboration, see this interesting talk, “Is there a real you?”, by philosopher Jiluan Baggini:
The view of “the self” emerging from these select quarters[2] of philosophy, religion, and neuroscience suggests that who we are may best be thought of in network terms. We are constituted by networks of associations: between perceptions, thoughts, feelings, memories, and behaviors. Many of these associations have their origin in our social networks, as argued and demonstrated by pioneering psychologists such as Lev Vygotsky and John Bowlby. Language itself has been conceptualized as an initially external tool which, once we acquire it through interactions with those in our early social networks, radically reconfigures our cognitive landscape and computational abilities. Networks of thoughts, feelings, and behaviors also make their marks on deeper levels of our biological makeup, altering gene expression through epigenetic mechanisms. Altered gene expression, in turn, means altered protein production, including for those proteins that shape the connectivity and operation of neural networks processing thoughts, feelings, and behaviors. We can begin to appreciate how “nature and nurture” are so interwoven that it can be technically difficult, if not conceptually misguided, to disentangle them. In short, we are fractals (see Chapter 1) in the sense that at all levels of bio-psycho-social organization, what can be found are networks. We’re networks all the way down.
As examples, here is a very small list of relevant networks:
- Genetic regulatory networks
- Metabolic networks
- Neural networks
- Brain networks
- Psychopathology networks
- Social Networks
- Food networks
- Sexual networks
Interestingly, all of these networks share some common properties, which we’ll explore in the next section. Indeed, in the words of complexity theorist Melanie Mitchell, “…network thinking is providing a novel language for expressing commonalities across complex systems in nature, thus allowing insights from one area to influence other, disparate areas”. I’ve already shown how one example of a framework with very diverse applications, cellular automata, could be used to understand the dynamics underlying phenomena such as the patterns of coloration on the coats of zebras and the spatial arrangements of ocular dominance columns in the occipital lobes of our brain. In chapters 2-4, our focus was on emergent, predictive, and contrast enhancing computation in neural networks. In this chapter, we zoom out to look at networks more generally. What we’ll see is how insights from one type of network, such as a social network, can be used to understand very different types of networks, such as large-scale brain networks!
Much of this book has dealt with core topics in the science of Complex Systems, including emergence, cellular automata, fractals, computation, information, and networks. To dive into these topics in even more detail, Complexity Explorer hosts a range of free courses that are always available, such as an Introduction to Complexity.
Properties of (Social and Brain) Networks
In Chapter 2, we examined abstract neural networks, in which neurons were represented by nodes (circles) and connections between circles by edges. Networks, more generally, have the same two basic elements. What differs between network applications is what those elements represent.
Consider the social network below. This is a network created using data I collected from an organization. The nodes represent individuals and the edges represent interactions between individuals in the organization. In this network, the nodes are different sizes, which reflect the general level of negative emotion experienced by each individual (an important aspect of the particular study that produced this network). The lines (“edges”) are different thicknesses as well, where thicker lines represent a greater frequency of interaction between individuals.
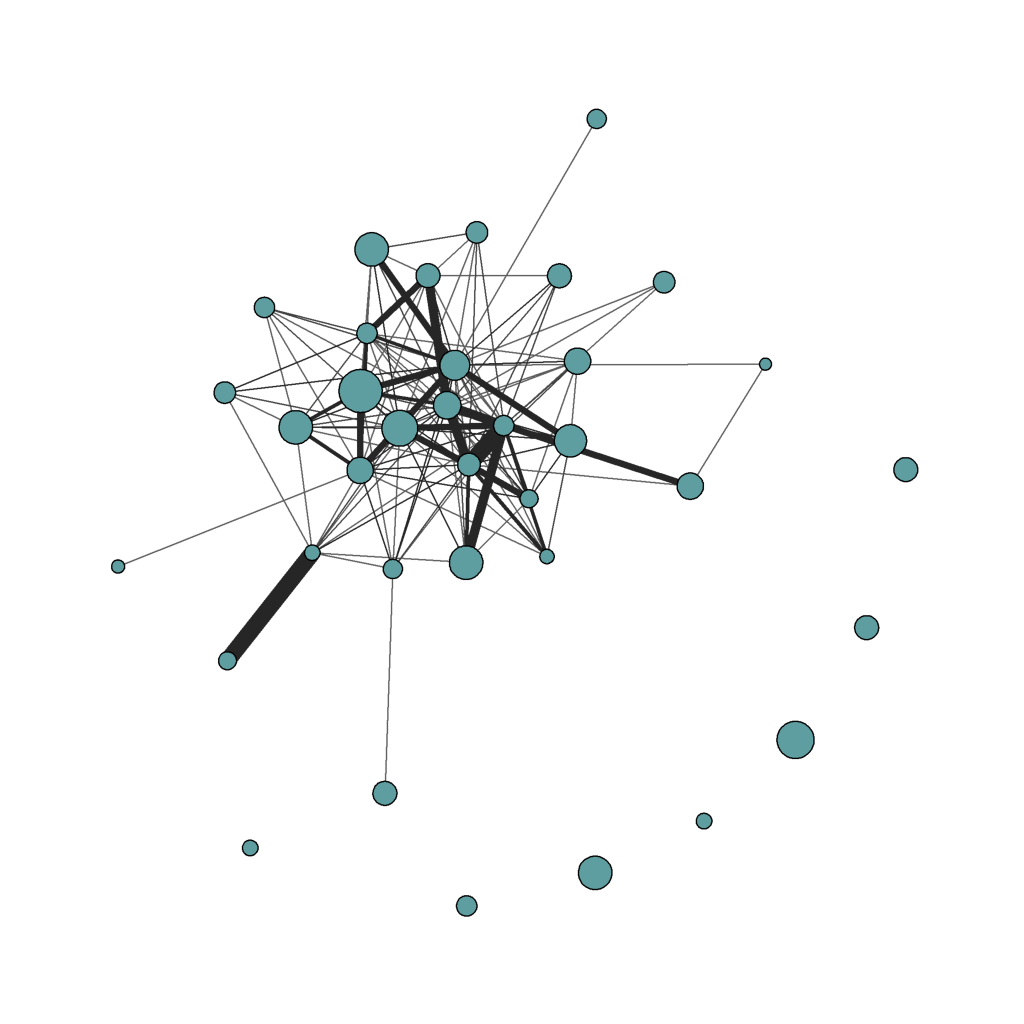
One thing you immediately notice is how differently connected individuals are. Some, on the periphery of the network, are like islands unto themselves, and don’t interact with others in the organization. Some interact with one, two, or many others. In network terms, the number of edges corresponds to the degree of a node. Isolated individuals have a degree of 0, while more connected individuals have a higher degree. This particular network is organized so that individuals with more and stronger connections are shown more centrally in the network. “Centrality” is an important characteristic because more central individuals are more likely to receive and pass on what may be flowing through the network. For example, if a non-central individual in the organization unknowingly had the coronavirus, the virus would be much more likely to spread to more central members of the organization than to other more peripheral members. In a more positive vein (pun intended), central members are more likely to have access to important information flowing through the organization than more peripheral members. You can also see that more central members tend to have higher “clustering”. Networks and regions within networks with higher clustering tend to have greater interconnections between members of a cluster community.
For additional examples of social networks, as well as a fascinating presentation of the kinds of things (contagions) that can flow through social networks and the importance of different positions within a social network, watch “The Hidden Influence of Social Networks” by sociologist Nicholas Christakis.
An important characteristic of all the networks listed in the previous section is that they are so-called small-world networks. In these types of networks, the path length, or number of connections, between any two nodes is very small—much smaller than you’d expect. An eye-opening study by renowned psychologist Stanely Milgram demonstrated that there are six-degrees of separation between individuals in the United States. In his study, he gave participants in one city a package and asked them to try to send it to a recipient unknown to them on the other side of the country by sending it to one other person (whom they knew) that they thought might be more likely to know the target recipient. Each intermediate recipient was given the same instructions. On average, the package was mailed 6 times to get between two random individuals! The small-world property has been shown to be quite common in a wide-range of network types. We’ll explore small-world networks in both social networks and brain networks shortly. But first, let’s investigate a model that can produce a small-world network.
Activity 5.1: Creating a Small World Network
- To readily create and play with a small-world network, download and install the free program Netlogo[3] (if you didn’t already in Activity 1.3 in Chapter 1).
- In Netlogo, click File –> Models Library. Expand the Networks folder, and then open the Small Worlds model.[4]
- Click on the “Info” tab and read the sections “What is it?” and “How it works”.
- Now return to the Interface and click “setup”. You see a network with num-nodes number of nodes where each node is initially connected to its two nearest neighbors. This is made more clear if you click on “highlight” and then one of the nodes.
- Note the initial clustering coefficient and average path length. Convince yourself that these numbers make sense. For help, you can read the “Statistics” section in the Info tab.
- Now, click “rewire-one”. Note how the clustering coefficient and average path length change for the whole network (shown numerically below the network and plotted in the Network Properties Rewire-One window).
- Now click “rewire-one” repeatedly. What happens? You can click “setup” and “rewire-one” many times to get a sense for the dynamics.
- How does the clustering coefficient change as the number of rewired edges increase?
- How does the average path length change?
- To more easily explore the relationship between the clustering coefficient and the average path length, click on “setup” and then “rewire-all”. This rewires every connection with a probability equal to the rewiring-probability. If this is set at 1.0, all edges will be rewired. If it is set lower, a smaller number of edges will be rewired. Systematically change the “rewiring-probability” value, clicking “rewire-all” for each value.
- At what rewiring-probability ranges is the average path length lower than the clustering coefficient?
- As noted in the “Thing to Notice” section of the Info tab, this range of values creates networks that are considered small-world networks.
- Increase num-nodes to the maximum value and try steps 7 and 8 again. What differences do you notice in a larger network?
Small-world networks have a short average path length and high clustering. This means that even though most of the edges in the network are local, connecting nearby neighbors (high clustering), traversing from one part of the network to another can be done using relatively few connections (short path length). Nodes in a network do not need to be highly interconnected with all other nodes in order for information (or any other type of transmission) to be efficiently communicated throughout the network. In Activity 5.1, you saw that the average path length decreased very quickly by just adding a small number of new longer-range edges in the network. These new pathways, rather than just connecting nodes, are connecting communities. This allows information to travel quickly both between and within communities. Small-world networks achieve high integration (via short path lengths and high clustering) at a relatively low cost (since network nodes don’t all need to be directly interconnected), which is why small-world networks have been frequently selected for, either by natural selection in evolution or by humans in engineering.
In real-world small-world networks, longer-range connections aren’t created randomly between nodes as they were in Activity 5.1. Rather, longer-range connections tend to diverge from and converge on a relatively small number of nodes. These very high degree nodes are called hubs. A disproportionately high amount of traffic within a network flows through these hubs, which serve a critical role in connecting diverse communities.
Perhaps one of the most familiar (and illustrative) examples of a network with a hub structure are the flight routes of airlines. Look at the map of global airline routes below. The thickness of the lines and the density of points on the map illustrate that certain cities are more common destinations than others. Many more flight routes converge on these hub cities than connect other cities. Nonetheless, you can still make out the territory of most of the rest of the world, which is lightly traced by a very large number of much more local routes. Hubs are the targets of all longer-range routes. Shorter-range routes connect nearby cities. You’ve likely experienced this hub-and-spoke network in your own travels. If you’re traveling from one smaller city to another smaller city that is not fairly nearby, you’ll likely have an intermediate layover at a much larger (hub) airport. Hubs facilitate connections between destinations while decreasing the need for (and cost of) direct connections between every pair of cities.
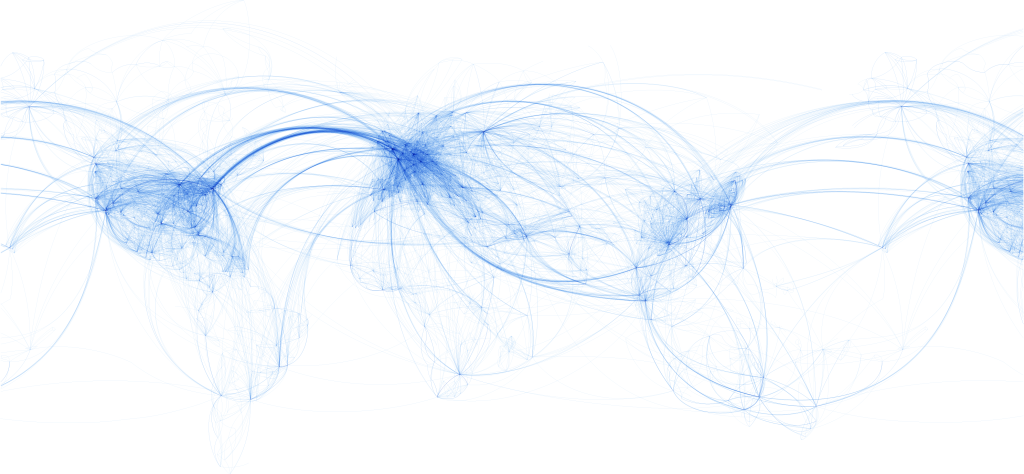
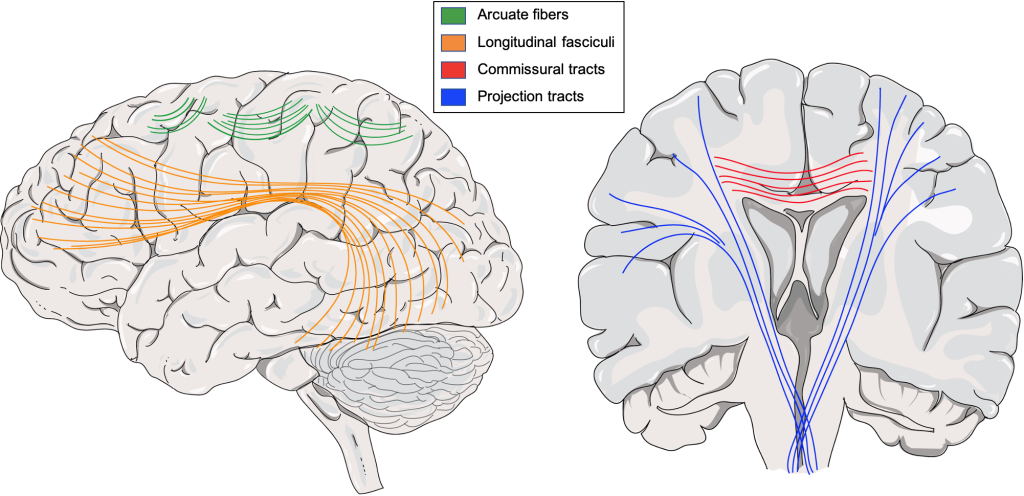
As it turns out, your brain has a similar organizational structure. Note the visual parallel between the tracts of long-range white matter in the brain diagram below with the air traffic map above.
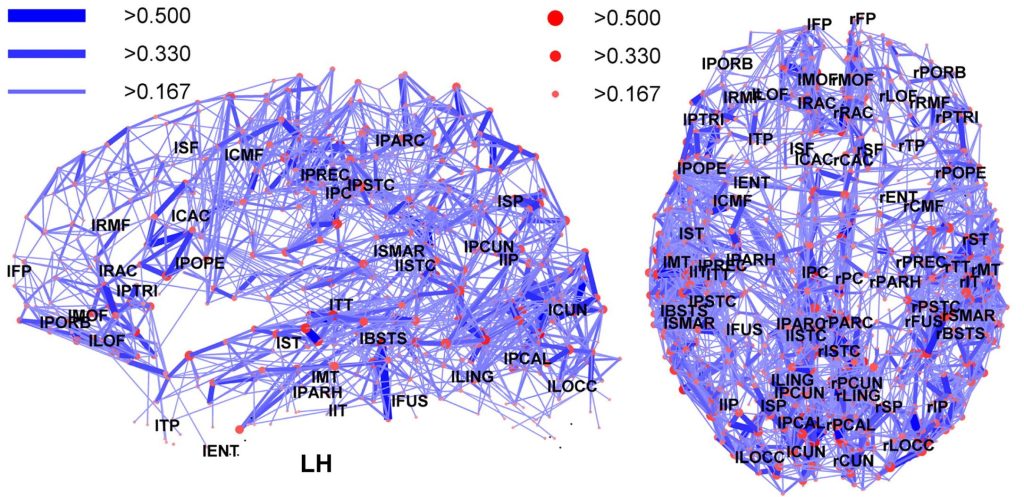
The small-world structure of brain organization, and its corresponding hubs, have also been formally demonstrated, as summarized in the two images below. The first shows a network from an individual brain, with only the more prominent nodes (brain regions) and edges (pathways) depicted. As with the air route image, you can discern both the overall map of the brain, as well as higher-volume areas. This becomes even more apparent in the second image, an average of several individuals’ connectome, which highlights the largest brain hubs and most common connection pathways between individuals. A number of hubs are themselves interconnected, forming a rich-club located in medial regions of the brain. Posterior portions of this medial rich club form part of the default mode network, which you’ll learn more about in the next chapter.

Why are small-world networks so common? Small-world networks represent the optimization of a tradeoff between the benefits and costs of connectivity.
Consider first your social networks. The most central members of your social network are part of your core discussion network. These are people with whom you have strong ties and are most likely to discuss important matters. Core discussion networks often include family members and good friends. You’ll have strong connections with these members, as reflected in characteristics such as emotional closeness and/or interaction frequency. The average size of Americans’ core discussion network whom they really confide in is between two and three people. Beyond the core discussion network is a larger network of friends and family with whom you feel varying degrees of closeness to and interact with more or less. Yet further out still are those whom you might consider acquaintances. A key difference between these types of relationships, in addition to felt closeness, is how much time and energy is invested in maintaining and reinforcing them. Given finite time and energy, we must choose where to invest, which has consequences for the size and connectivity of our social networks. However, weaker ties with more distant members of your network are vital. Weak ties often link more people (we have more acquaintances than good friends) and provide access to information and resources that may not otherwise be available. This is the value of “networking”, for example, in which you forge weak connections with others who may enable new professional opportunities. A robust social network is one in which there is a mix of strong and weak ties, requiring more or less investment, respectively.
Airlines must also choose how to invest finite resources. It is not possible to connect all possible pairs of cities with flights that both run frequently enough to meet demand and are full enough to be profitable for the airline. Instead, airlines invest a disproportionate amount of resources in particular destinations through which air traffic is channeled. This method of relying on hubs optimizes a tradeoff between a desire for efficient connectivity and limited resources for creating and maintaining connectivity.
Like social networks and airline networks, brain networks are also organized to optimize the connectivity tradeoff. While information integration across the brain is critical, connections are costly. Maintaining neural connections and facilitating neural communication across those connections requires enormous metabolic effort. Indeed, the brain consumes approximately 20% of your daily energy intake, despite only accounting for 2% of your body mass. Increasing brain connectivity would massively increase both the amount of energy we would need to acquire as well as the size of our heads, which would need to accommodate substantially more wiring! These costs are prohibitive. Instead, the brain maximizes information integration while minimizing connectivity costs by investing in a higher percentage of relatively cheap short-range (and unmyelinated) connections between neighboring regions and a smaller percentage of more expensive long-range (and myelinated) connections to hub regions. In short, the brain has evolved to develop a small-world network organization with short path lengths and high clustering.
So far, we’ve seen examples of how diverse types of networks can share important properties. This means that interrogating one kind of network, such as a social network, can provide insight into principles and processes that may have analogues in other networks, like brain networks. To further stimulate “network thinking”, I invite you to map and explore a social network in the next activity. Then, we’ll continue to examine commonalities between social networks and brain networks in the next section.
Activity 5.2: Mapping a Social Network
This activity can be done by hand or by using a free add-in for Excel, NodeXL, which allows you to create and analyze network graphs like the ones at the beginning of this section as well as below. The hand-drawn networks will necessarily be much simpler. There are separate instructions below, depending on how you do this activity.
First, choose a social network you would like to map. This could be a network of a class or a personal social network.[5]
If you are creating your network by hand:
1. Create a shareable document with the names of all the people in the network you have chosen to create and a scale for quantifying relationships between them. For example:
Indicate how well you know each of the names on this list, using the following scale:
0: We don’t (really) know each other.
0.5: We are acquaintances
1: We are friends
Names:
___ Will
___ Katie
___ Jess
2. Draw circles for each individual. If a pair of individuals are acquaintances, draw a dashed line between them. If a pair of individuals are friends, draw a solid line between them.
3. Examine the degree distribution of your network. That is, look for the range of numbers of connections coming from nodes. Some nodes will probably have very many connections, and some very few.
4. Is there much clustering in your network? That is, are groups of nodes highly interconnected?
5. How easy or hard would it be for information to flow from one part of the network to another?
- In Connected, James Fowler and Nicholas Christakis review research showing how we are influenced by our friends’ friends’ friends. Do people in your network appear to be influenced by people they don’t even know (people three degrees removed with whom they are not directly connected)?
6. Does your network appear to exhibit any of the properties discussed earlier?
If you are creating your network using NodeXL:
1. Create a shareable document with the names of all the people in the network you have chosen to create and a scale for quantifying relationships between them. Here are two examples I have used:
On a scale of 0-1 (in 0.1 increments), rate how close you are to each of the following people:
Indicate how well you know each of your classmates, using the following scale:
1: We don’t know (really) each other
2: We are acquaintances
3. We are friends
4. We are very close
Names:
___ Will
___ Katie
___ Jess
2. You could also consider collecting more data, such as how extraverted each individual is. You could do this by asking each individual to fill out the extraversion-related questions of the Big Five Inventory.
3. Enter data into NodeXL and use it to generate a network with different kinds of layouts and to compute different types of metrics (e.g., node degree, centrality, and more).[6] You can also make each node proportional to the individual’s extraversion score (as a way of examining characteristic clustering) as I have done for a class here:

4. See questions 3-6 in the “hand network” instructions above.
Homophily and Homunculi
In the previous section, we saw that just a small percentage of longer-range connections between otherwise locally clustered communities can create a small-world network which optimizes a tradeoff between the advantages of network-wide communication and the disadvantages of connection cost. In this section, we focus on the properties and effects of this local clustering.
Homophily (“love of sameness”) is best described by the mnemonic: “birds of a feather flock together”. Homophily is highly prevalent in social networks. We tend to share similar values, ideas, interests, and behaviors with those more closely connected to us. Sometimes this is because of assortativity, where we choose to associate with those that are similar to us in important respects. We choose friends, for example, that share common interests that can be jointly discussed or practiced. It’s also well established that “birds of a feather flock together” is much more true of partners in a romantic relationship than the adage “opposites attract”. As the authors of “Birds of a feather: Homophily in social networks” write, “similarity breeds connection”. Another driver of homophily is induction. Here, one person influences another such that they become more similar. For example, one friend may join a gym and then encourage another to do so as well. Or one friend may start a reading group, which prompts other friends to discuss ideas in ways they otherwise might not. Influence can also be much more subtle. As Nicholas Christakis notes in his talk included in the last section: friends may implicitly influence their friends’ norms about a wide range of different kinds of behaviors, views, or characteristics. Whereas “similarity breeds connection” describes assortativity, “connection breeds similarity” describes induction.
The voting patterns of local communities across the United States vividly illustrates homophily. Consider the image below, of the 2016 presidential election results. Communities coded red voted more for the candidate from one political party, while communities coded blue voted more for the candidate from another political party. The “red party” was clearly the most popular. But look at the blue communities. They tend to aggregate in large clusters of communities. You do occasionally see isolated blue communities in a sea of red, but more commonly, groups of communities tend to vote similarly. This is homophily.

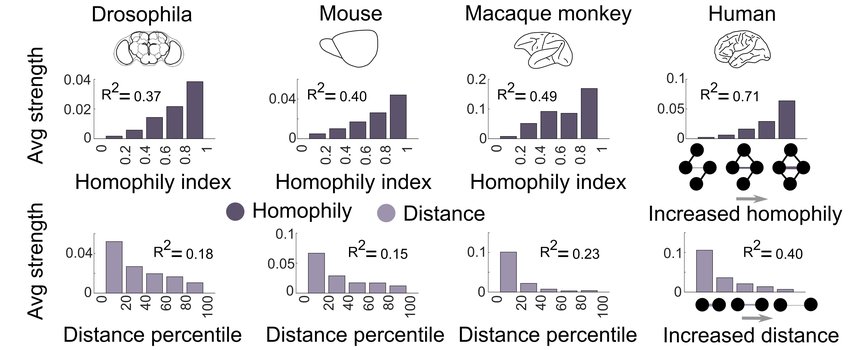
Homophily also characterizes brain networks. High homophily can be found not only in human brains, but also in fly, mouse, and monkey brains,[8] as shown in the figure below. The image further illustrates that brain homophily is associated with stronger connections between more closely located regions and weaker connections between more distant regions. Just as in social networks, brain networks have a mix of strong and weak ties underlying their small-world structure.
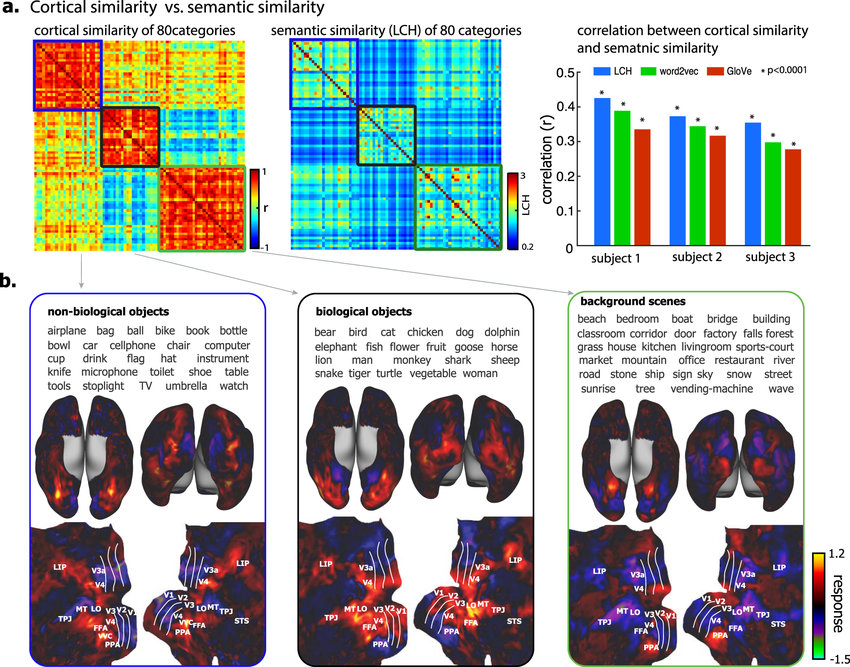
At a macro, or systems, level, homophily is reflected in a high degree of modularity and localization of brain function. Regions of the brain take on specific functions and neighboring regions take on distinct, yet related, functions. For example, the functional hierarchy of visual cortices is fairly well mapped, beginning with the representation of lines in primary visual cortex (V1), proceeding to somewhat more complex processing in secondary areas of the extrastriate cortex, and then differentiating into two specialized processing streams: the ventral “what” (object recognition) pathway and the dorsal “where/how” (spatial awareness/object action) pathway. Recent work further shows (see figure below) that within object-processing visual areas, cortical clusters can be identified for representational clusters (categories) of objects corresponding to biological objects, non-biological objects, and background scenes.
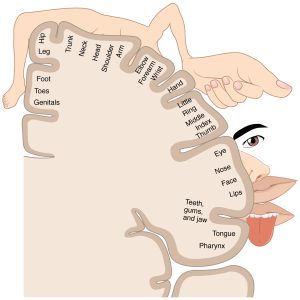
Similar representational clustering can be found in the cortices for other sensory systems as well. For example, the primary auditory cortex (A1) in the superior temporal gyrus has a tonotopic organization. Small regions within A1 preferentially process select frequencies of sounds, and neighboring regions within A1 process slightly higher or lower frequencies. Over the extent of A1, this creates systematic progressions of frequency-specialized cortex. In the primary somatosensory cortex (S1), located in the postcentral gyrus of the parietal lobe, we see the different regions of the gyrus specialize in processing tactile input coming from different body parts.[9] In other words, S1 has a somatotopic organization. An aggregate illustration of these different body part representations is called a somatosensory homunculus, as shown below. This homunculus has oversized hands and lips, relative to the physical size of our body, because of the higher density of tactile receptors in these regions.
More generally, the differentiated cytoarchitecture (cellular distribution) of the cortex into Brodmann areas, which generally correspond to distinct functions, evidences the pervasiveness of homophily in the brain.
Perhaps you’ve noticed that I just introduced the somatosensory homunculus of the brain, whereas in the first section of this chapter I said that neuroscience rejects the notion of homunculi in the brain. What gives? To be clear, the somatosensory homunculus is a visual representation of the sizes of different cortical regions responsible for tactile processing. It’s an abstraction from the brain, not something that resides in the brain. Or to put it another way, touch isn’t processed by a “little man” in the cortex, but rather by a network of functionally distinct regions, operating with their own neural networks. We really are networks all the way down.
- Quarters within philosophy, religion, and neuroscience converge on the perspective that “the self” is not a “thing”, an essential core of our being with ontological status, but rather is better conceived of as a bundle (Hume), aggregate (Buddhism), or network (neuroscience) of associations between (at least) perceptions and cognitions.
- Networks are found at all levels of “self” organization, such as gene regulatory networks, brain networks, psychopathology networks, and social networks.
- Many networks share common properties, such as being a small-world network.
- Small-world networks are characterized by short path lengths and high clustering. They feature a relatively small percentage of longer-range connections, converging on hubs, which connect otherwise locally interconnected regions that have a high percentage of shorter-range connections.
- Small-world networks optimize a connectivity tradeoff between the advantages provided by network integration and coordination on the one hand, and the costs of creating and maintaining (particularly long-range) connections on the other hand.
- Because many types of networks share properties, like having a small-world structure, understanding one type of network (like a social network) can provide insight into potential analogue structures and processes in another type of network (such as a brain network).
- Both social networks and brain networks exhibit homophily, where “birds of a feather flock together”.
- In the brain, homophily is reflected in a high degree of modularity and localization of cortical function.
- This is vividly exemplified within and across sensory systems of the brain.
- Though neuroscientists use a “somatosensory homunculus” as a visual representation of function-specific regional size differences in the primary somatosensory cortex, neuroscientists don’t refer to homunculi as explanatory agents.
- We are networks all the way down.
Media Attributions
- Social Network Example © Christopher J. May is licensed under a CC BY (Attribution) license
- World_airline_routes © Josullivan.59 is licensed under a CC BY (Attribution) license
- White Matter Tracts © Daniel Donnelly adapted by Chiara Mazzasette is licensed under a CC BY (Attribution) license
- Network representation of brain connectivity © Hagmann P, Cammoun L, Gigandet X, Meuli R, Honey CJ, Wedeen VJ, Sporns O adapted by Was a bee is licensed under a CC BY (Attribution) license
- Average Regional Connection Matrix, Network Layout, and Connectivity Backbone © Patric Hagmann, Leila Cammoun, Xavier Gigandet, Reto Meuli, Christopher J Honey, Van J Wedeen, Olaf Sporns is licensed under a CC BY (Attribution) license
- Extraversion Class Social Network © Christopher J. May is licensed under a CC BY-NC (Attribution NonCommercial) license
- 2016_Presidential_Election_by_County © Ali Zifan is licensed under a CC BY-SA (Attribution ShareAlike) license
- Homophily-physical-distance-and-strength-heterogeneity-of-empirical-brain-connectomes © A. Goulas, R. F. Betzel, C. C. Hilgetag is licensed under a CC BY-NC (Attribution NonCommercial) license
- Categorical similarity and clustering in cortical representation at the scale of the entire visual cortex © Haiguang Wen, Junxing Shi, Wei Chen, Zhongming Liu is licensed under a CC BY (Attribution) license
- 1421_Sensory_Homunculus © OpenStax College is licensed under a CC BY (Attribution) license
- Front of Sensory Homunculus © Mpj29 is licensed under a CC BY-SA (Attribution ShareAlike) license
- These ideas also are consistent with the “4E” conception of cognition briefly introduced in the Preface, according to which the mind is not contained in the brain nor bound by the skull. ↵
- For a fuller, contemporary perspective, see here, where the author writes, “...what we call self consists of a complex and sufficient pattern of certain contributories, none of which on their own is necessary or essential to any particular self. This is not a pattern theory of “the self.” Rather, what we call “self” is a cluster concept which includes a sufficient number of characteristic features. Taken together, a certain pattern of characteristic features constitute an individual self.“ ↵
- Wilensky, U. (1999). NetLogo. http://ccl.northwestern.edu/netlogo/. Center for Connected Learning and Computer-Based Modeling, Northwestern University, Evanston, IL. ↵
- Wilensky, U. (2015). NetLogo Small Worlds model. http://ccl.northwestern.edu/netlogo/models/SmallWorlds. Center for Connected Learning and Computer-Based Modeling, Northwestern University, Evanston, IL ↵
- Please consider the potential discomfort that asking for data of the kind indicated next might cause. This will be context dependent. If in doubt, choose rating criteria and questions that are more neutral. It’s also important to disclose whether collected information will be (potentially) made available to others. ↵
- I can’t succinctly give step-by-step instructions here, but your own resourcefulness should do the trick! ↵
- Wilensky, U. (1998). NetLogo Voting model. http://ccl.northwestern.edu/netlogo/models/Voting. Center for Connected Learning and Computer-Based Modeling, Northwestern University, Evanston, IL. ↵
- For those interested, the two papers linked in this paragraph also provide insight into the mechanisms driving a homophilic organizational structure of the brain. ↵
- Neurons downstream from mechanoreceptors in the skin have center-surround receptive fields, mediated by lateral inhibition. Just like the visual system, the somatosensory system relies on contrast enhancement, as discussed in Chapter 4. ↵
