Chapter 1. OBSERVATION: Daily Rhythmicity
Millennia ago, our ancestors had already recognized rhythms of plant and animal behavior that appeared to cycle every 24 h, seemingly to match the length of time it takes for the Earth to complete one rotation about its own axis. We will discuss terminology at the end of this chapter, but here we reserve the term “daily rhythm” for a biological rhythm expressing a 24-h cycle length in the presence of a repeating 24-h external timing event (for example, external events such as the sun rising every morning, an alarm clock ringing at 6:00 AM daily, artificial lights turning on in an animal facility at 8:00 AM or a bolus of food appearing at 6:00 PM daily).
There is not one single “daily rhythm,” but a universe of them ![]() 1.1. Daily rhythmicity is a feature of biological processes (in biochemistry, metabolism, physiology, and behavior) and is now studied across organisms (including photosynthetic bacteria, unicellular eukaryotes, fungi, plants, and animals), within organisms (in organelles, cells, tissues, organs, and physiological systems), and between organisms (flowering plants and their pollinators, eusocial insects, conspecific group living, parasitism and mutualism, pathogens and their vectors and hosts, and human societies). They are wide-ranging, from rhythms of overt activity to rhythms of sensitivity and responsiveness only revealed by an imposed challenge or perturbation. They express a variety of shapes (waveforms), from near-sinusoidal to bimodal, or even more complex; as well as differential timing (phases; for example, the timing of a rhythm’s onset, peak, offset, or other marker) that can occur at any point throughout the entire 24-h cycle.
1.1. Daily rhythmicity is a feature of biological processes (in biochemistry, metabolism, physiology, and behavior) and is now studied across organisms (including photosynthetic bacteria, unicellular eukaryotes, fungi, plants, and animals), within organisms (in organelles, cells, tissues, organs, and physiological systems), and between organisms (flowering plants and their pollinators, eusocial insects, conspecific group living, parasitism and mutualism, pathogens and their vectors and hosts, and human societies). They are wide-ranging, from rhythms of overt activity to rhythms of sensitivity and responsiveness only revealed by an imposed challenge or perturbation. They express a variety of shapes (waveforms), from near-sinusoidal to bimodal, or even more complex; as well as differential timing (phases; for example, the timing of a rhythm’s onset, peak, offset, or other marker) that can occur at any point throughout the entire 24-h cycle.
Now let us suppose that by serendipity, sloppiness, or design, you have repeated the same measurement or observation of a biological process at multiple times around the clock, and the values appear to be different! Perhaps inaccurate technique is the culprit, but is a process that undergoes a predictable daily rhythm in its level or activity another explanation for this difference?
Or let us suppose that your transcriptomic profiling of normal and diseased tissues collected at a specified time point reveals strong differential expression of several canonical “clock” genes! Perhaps the disease state is indeed associated with altered absolute levels of gene expression, but is another explanation that the transcripts are similarly expressed in both conditions but as daily rhythms with their peaks at different phases?
Interesting! So, what do you do now?
***
How do I know if variable data collected at different times represent a daily rhythm?
Even if a 24-h rhythm in the data appears obvious by visual inspection, you’ll want to apply statistical analyses to confidently establish and describe its features. For sure, the nuances of time series analyses are complex and the subject of an extensive literature, so you may eventually wish to consult or even collaborate with a knowledgeable statistician. However, there is no substitute for initiating your analysis by first plotting the raw data points before submitting them to automated processing. You will have the opportunity to identify possible outliers, perhaps interesting or unexpected features, and potential trends across the record.
Choosing the most appropriate analysis for a time series ![]() 1.2 is guided in large part by the characteristics of the dataset: these include what is being measured, the number of cycles and the number of time points recorded per cycle, whether the data points are equally or unequally spaced and normally or non-normally distributed, the complexity of the waveform, and the presence of zeros (as for example, in a behavioral activity rhythm with long intervals of absent activity). Typically, and for practical purposes, 6 time points over 24 h – that is, sampling every 4 h – would be considered adequate for the most basic description of a daily rhythm. Obviously, more sample points would allow for more precise description of waveform
1.2 is guided in large part by the characteristics of the dataset: these include what is being measured, the number of cycles and the number of time points recorded per cycle, whether the data points are equally or unequally spaced and normally or non-normally distributed, the complexity of the waveform, and the presence of zeros (as for example, in a behavioral activity rhythm with long intervals of absent activity). Typically, and for practical purposes, 6 time points over 24 h – that is, sampling every 4 h – would be considered adequate for the most basic description of a daily rhythm. Obviously, more sample points would allow for more precise description of waveform ![]() 1.3. However, confidence in the rhythmicity itself and in the estimation of its parameters is generally improved more by increasing the number of cycles in the series than by increasing the sampling rate.
1.3. However, confidence in the rhythmicity itself and in the estimation of its parameters is generally improved more by increasing the number of cycles in the series than by increasing the sampling rate.
Key rhythm parameters (Fig. 1) are period, phase, amplitude, and mean level.
- Period is the interval of time for the rhythm to complete one cycle; in the case of a daily rhythm as we have defined, the period is thus 24 h. By the way, period and frequency are related; frequency is the reciprocal of period, in this case as the number of cycles per hour. When there is one cycle per 24-h day, the period is 24 h, but this can also be expressed as a frequency of 1/24 = 0.04166… h-1 (cycles/h or in International System (SI) Units as 0.000015741 Hz), but thankfully no one does that.
- Phase is a defined reference point within the cycle, representing the instantaneous state of the oscillation. The time interval between two identical phases in successive cycles – for example, onset of activity – is equal to the period of the rhythm. For analytical purposes, the choice of a phase marker(s) is important, non-trivial, and will be noted in Chapter 2.
- Amplitude is the difference between the maximum or minimum value of a rhythm and its mean level (not the difference between the maximum and the minimum values, which is the range of the oscillation).
- Mean level is the value around which the rhythm oscillates, corresponding to the arithmetic mean if the rhythm waveform is symmetrical. Of course, the mean level can change with or without a change in amplitude.
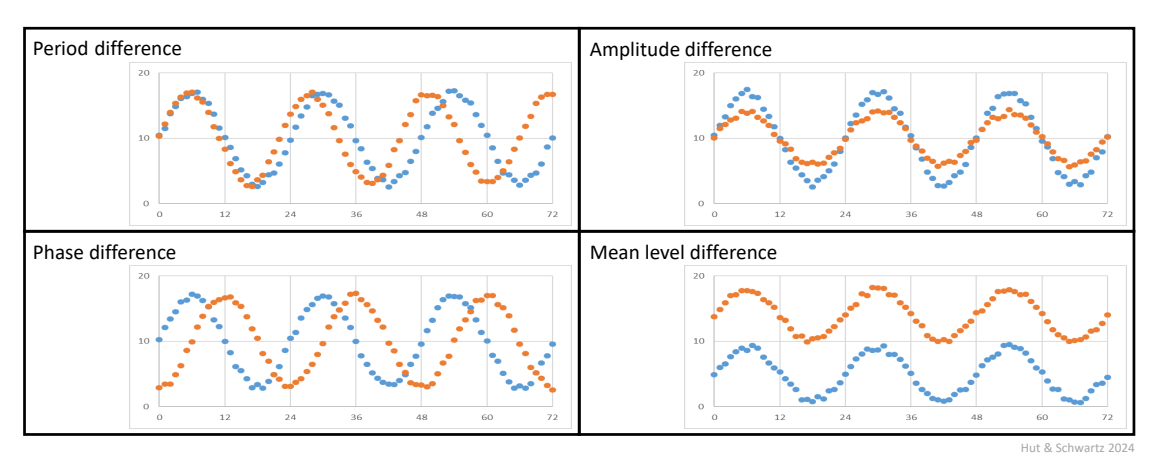
Note that a difference in period cannot be distinguished from a difference in steady-state phase if the rhythms are only recorded over a single cycle.
***
Why display rhythmic time series as “actograms”?
Ordinarily time series are graphed with the independent variable (time) plotted horizontally from left to right on the x-axis, while the dependent variable (say, measured value) plotted vertically on the y-axis. Changes in amplitude and mean level are easily visualized in this way, but subtle variations in period and phase may be less apparent. The “secret handshake” of the circadian biologist is an alternative display known as the actogram (but also useful for plotting variables other than activity), with one 24-h period plotted horizontally and successive calendar days vertically from top to bottom. In this way, any disruption in the vertical alignment of rhythm phases over succeeding cycles is usually clear (Fig. 2).
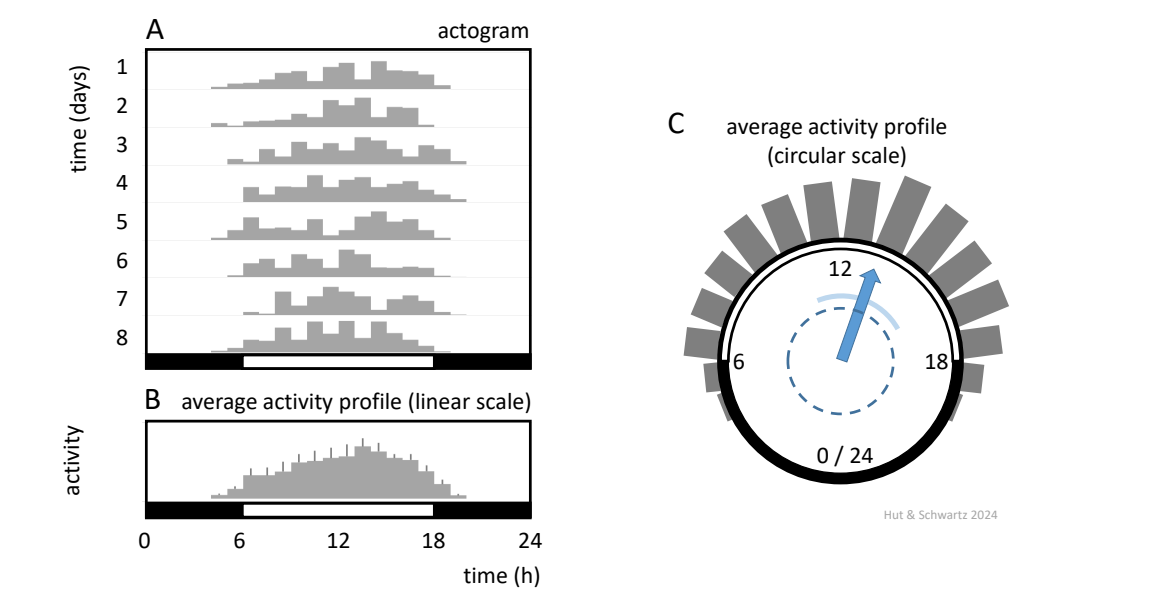
(A) Actogram, in which the daily variation of activity patterns in a diurnal animal is shown over 8 consecutive 24-h days, as a bar graph showing total activity per hour. At bottom: white bar, lights-on; black bar, lights-off.
(B) Average Activity Profile from (A) plotted on a linear scale, constructed by averaging activity levels for each hour over 24 hours; error bars indicate standard errors based on variation per hour between days.
(C) Average Activity Profile from (B) plotted on a circular scale, allowing determination of the center of gravity (CoG, blue vector) by goniometric approach (using the average of the activity-weighted sines and cosines to calculate the direction and length of the CoG vector by the arcTan function). The width of the circular distribution (the spread around the circle) is represented by the circular standard deviation (light blue arc). Rhythmicity in the original data can be determined when the Raleigh test identifies significant directionality (difference from an equally spread circular distribution), when the CoG vector length is greater than the radius of the dashed circle.
Actograms were initially popularized especially for displaying the behavioral rhythms of rodents (hence the name, “activity-gram”). It was at a time that rhythm amplitude was not readily measurable; the methods used to record events involved pens on white paper or needles on smoked paper and did not have the temporal resolution to accurately measure the degree (intensity) of activity. Such actograms highlighted period and phase, which was a chief aim being pursued by investigators at the time ![]() 1.4.
1.4.
***
What do I do if it is not possible to make repeated measurements over multiple cycles?
There are certainly circumstances when multi-cycle, longitudinal measurements from an individual organism or preparation cannot be made (for example, if obtaining tissue for biochemical, immunohistochemical, or transcriptomic analyses). The practical solution to this situation has been to sample multiple groups of individuals at pre-determined time points – say, every 4 h – and to test for a statistically significant variation between the groups as a function of time over the 24-h cycle. Obviously and importantly, the fidelity of any educed “rhythm” determined in such cross-sectional fashion will critically depend on the confidence of randomization across the groups and the number of sampling times (as well as, for example, such details as the care in processing samples from all groups together). While ANOVA is commonly employed to show differences across groups over time, it is important to remember that significant non-uniformity of groups by ANOVA does not demonstrate periodicity. Also, a reminder that temporal data on phase are circular (periodic), not linear; that is, a 24-h clock time of, say, 23 h 55 min is closer in time to 0 h 5 min than it is to 23 h 40 min on a circular scale, as on a clock face. If computing an average daily phase across individuals, one cannot simply perform an arithmetic average of the clock times as placed on a linear scale. The most common statistical procedure to distinguish whether circular data are uniformly distributed or with a preferred (unimodal) direction is the Rayleigh test, which calculates the position of the circular average by goniometry (Fig. 2).
And here is one final note of caution. Biological variability of a measure within a group at a specified time point (say, the intensity of an immunohistochemical signal) could arise in two ways if the measure is indeed rhythmic (Fig. 3). One is by variability in individual amplitudes (typically acknowledged by error bars at that time point), and the other is by variability in individual phases (which cannot be known by a measurement at a single time point); and these two sources of variation are not mutually exclusive. Thus, the parameters of a “rhythm” calculated from multiple groups of individuals sampled over a 24-h interval may not mirror those of any one rhythmic individual.
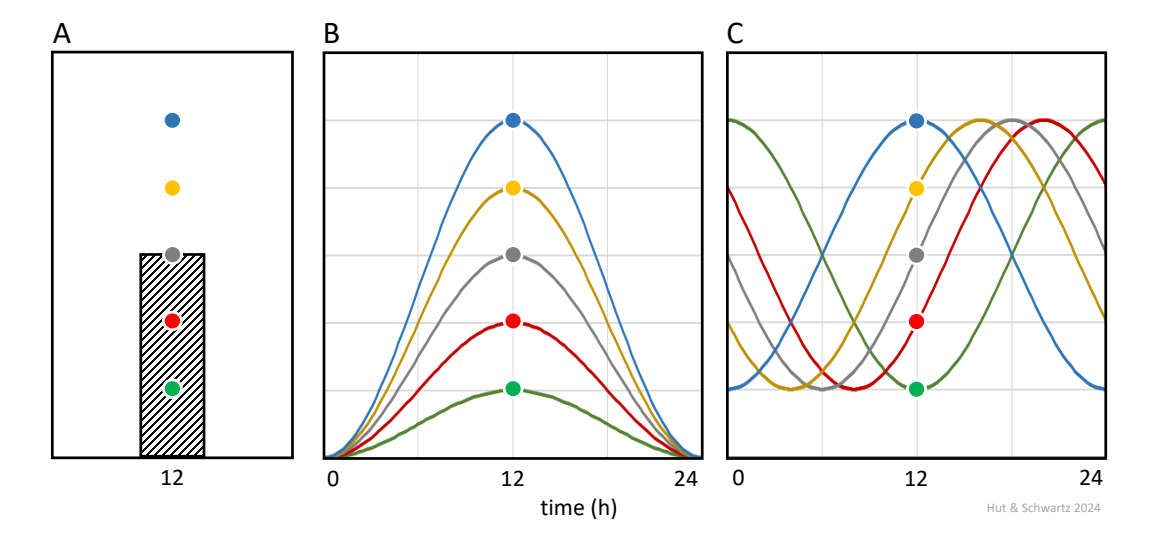
Biological variation across samples at a specified time point (A) may arise from variation in rhythm amplitude (B) or phase (C), or both, and cannot be distinguished.
In the extreme case, absence of 24-h rhythmicity might be concluded from group data even if there actually were a rhythm but with widely distributed phases between the individuals (Fig. 4).
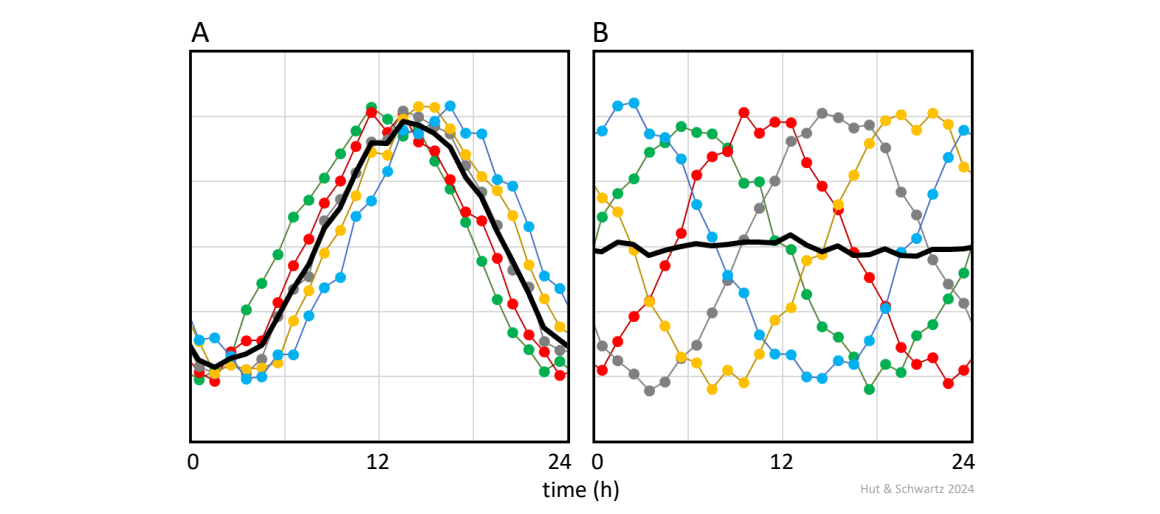
Average rhythms extracted from group data (in black) may show reduced amplitudes when the phase difference between individual patterns increases (compare panel A with B).
Note that for a stable daily rhythm inferred by the timed sampling of multiple groups, extending the experiment from 24 h to 48 h or longer does not provide a longitudinal measurement, although it can serve to produce independent biological replicates of samples at similar time points over the 24 h cycle (importantly, however, see ![]() 1.5).
1.5).
***
Terminology check-in
We wish to earnestly assure you that we are not overly fastidious people, but we do believe that the terminology we use in our field merits special attention and care. Vague or inconsistent use of terms can lead to miscommunication, propagation of errors, and faulty design and interpretation of experiments. In this regard, we are aware that daily rhythms are sometimes referred to as “diurnal rhythms,” which we feel is confusing. A “nocturnal” rhythm is understood to be one that is night-active (peaking during the dark interval); so, we recommend that the term “diurnal” rhythm be restricted to one that is day-active (peaking during the light interval). In this way, both diurnal and nocturnal rhythms are daily rhythms but with (roughly) opposite phases.
We favor “daily” as the adjective for a rhythmic pattern that occurs every 24 h in the presence of a repeating 24-h external timing event, but you may come across “diel” or “nycthemeral” (or spelled “nychthemeral”), apparently used synonymously. Actually, nycthemeral is arguably a more specific term than daily; according to the Oxford English Dictionary, it is derived from nycthemeron, defined as a period of 24 h that consists of a day and a night.
Incidentally, we’ve also seen that the word “day,” in isolation, can be ambiguous! Does it refer to the light interval of a light-dark cycle (that is, as in day and night)? Or is it the Earth’s 24-h “day” (in distinction, for example, to Mars’ 24.62 h “day”)? Or is it that part of the 24-h cycle occupied by the waking hours (as in, “he filled his day with participation in outdoor sports”)? For these reasons, we try to avoid “day” except if put in context (as in “24-h day,” “day and night,” or “daytime and nighttime,” or “subjective day and subjective night” [see Chapter 2 for a description of the term “subjective”]).
For an accessible and reasonably complete glossary of terms in circadian biology, consider
https://www.circadian.org/dictionary.html
